PRTG – (10149) * UP LINK PORT * Traffic
This page explains how to interpret the PRTG sensor (10149) UP LINK PORT – Traffic and how to read its units against a 1 Gbit/s uplink.
Units and reading usage as % of a 1 Gbit/s link
PRTG usually displays this sensor’s throughput in kbit/s (kilobits per second).
Reference conversions
- 1 Gbit/s ≈ 1,000 Mbit/s ≈ 1,000,000 kbit/s
Capacity usage formula
- Usage % = (value in kbit/s ÷ 1,000,000) × 100
Quick examples (for a 1 Gbit/s uplink)
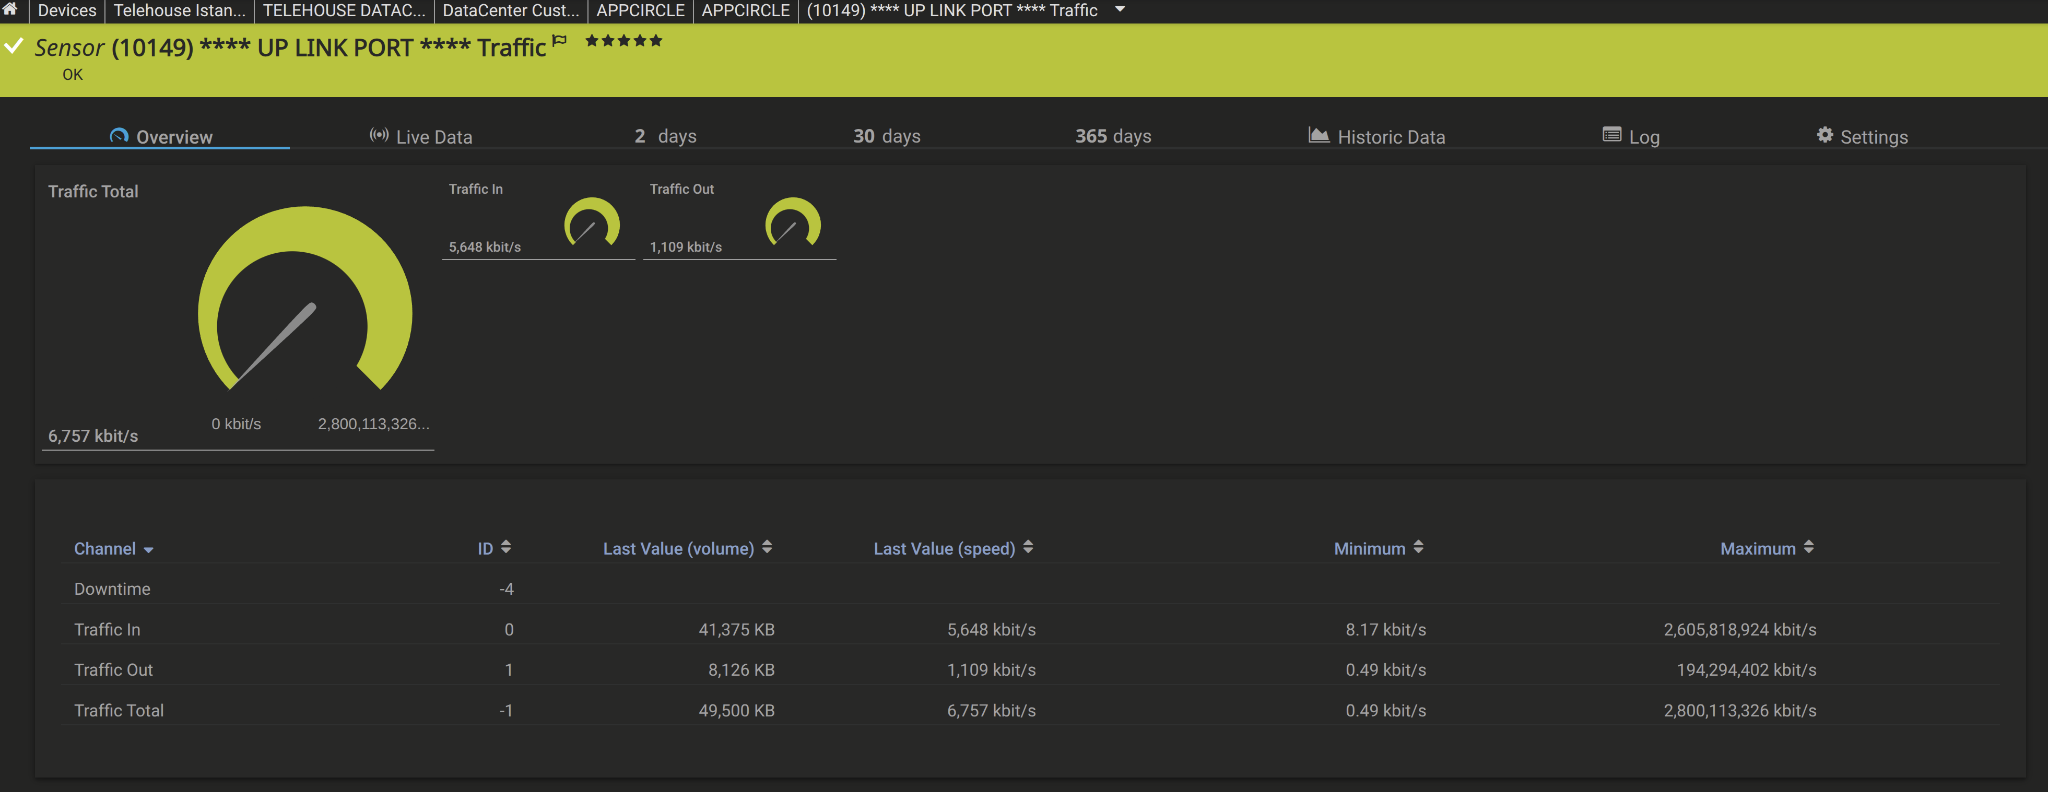
- 6,757 kbit/s (Traffic Total) → 0.676% of capacity
- 5,648 kbit/s (Traffic In) → 0.565% of capacity
- 1,109 kbit/s (Traffic Out) → 0.111% of capacity
Bit vs Byte (to reduce confusion)
- 8 bits = 1 byte
-
Approx conversion kbit/s → MB/s: kbit/s ÷ 8,000
-
Example: 8,000 kbit/s ≈ 1 MB/s
- 1 Gbit/s ≈ 125 MB/s
Note on “Maximum” values: If the “Maximum” column shows values far above the physical link capacity (for example, 2.8 billion kbit/s), it is typically a spike/anomaly caused by SNMP counter behavior (poll timing, counter wrap/reset, etc.). For capacity planning, focus on averages, p95/p99, and sustained high-usage trends instead of single-point maxima.
1) Sensors (List) page
Shows sensors under the selected object in a table.
In this case, there is a single sensor: (10149) UP LINK PORT – Traffic.
Key columns:
- Status: Current sensor state (Up/Warning/Down/Unusual, etc.).
- Last Value: The latest reading of the sensor’s primary channel (for example, Traffic Total – kbit/s).
- Message: Short health message (for example, OK).
- Graph: Small preview graph (usually Traffic Total).
- Priority / Fav. / Perf. Impact: Priority, favorite flag, and PRTG performance impact.

2) Overview page
A dashboard-style view of the sensor.
Top gauges typically show:
- Traffic Total: Total throughput (In + Out).
- Traffic In: Incoming traffic to the port.
- Traffic Out: Outgoing traffic from the port.
The Channel table below shows:
- Last Value (volume) and Last Value (speed) per channel.
- Minimum / Maximum values for the selected time span.
- Downtime information (unreachable/down states).
3) Live Data page
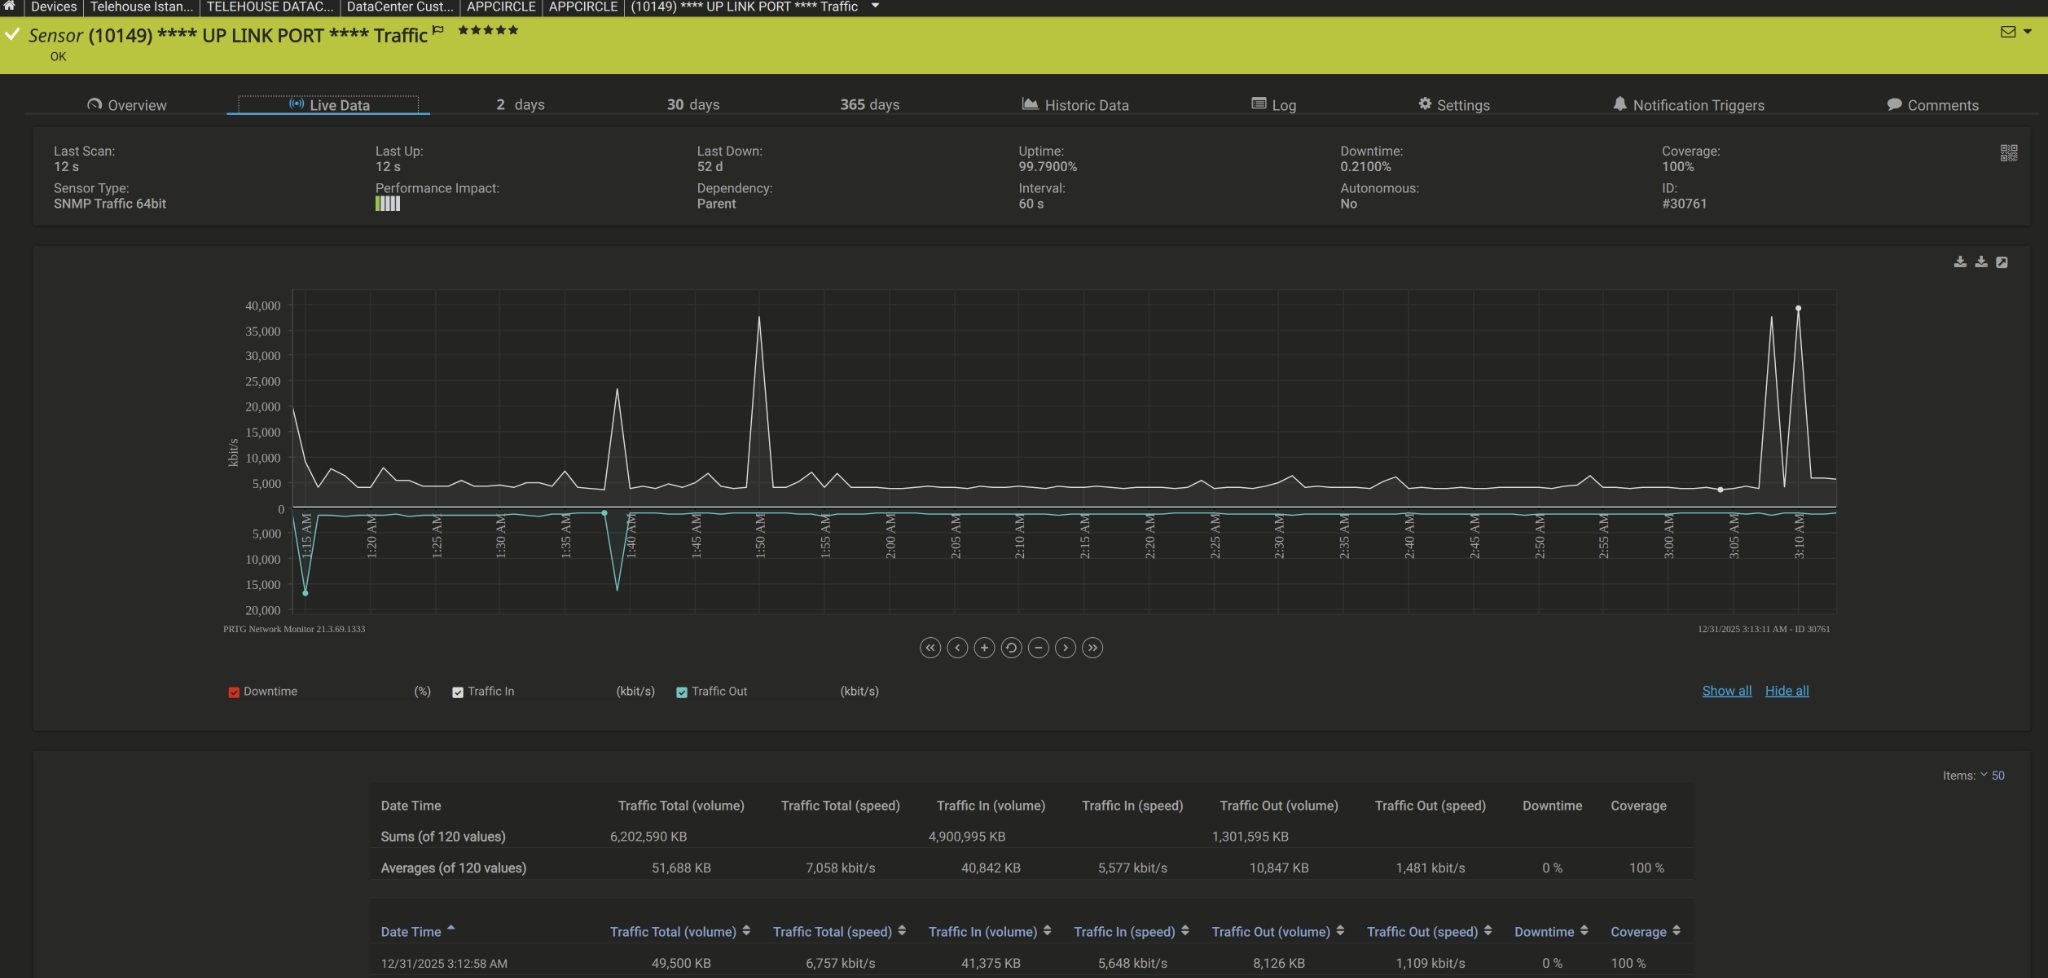
Shows short-term traffic changes (typically near real-time) as a line graph.
Graph channels commonly include:
- Traffic In (kbit/s)
- Traffic Out (kbit/s)
- Downtime markers (if applicable)
The table below the graph:
- Lists measurements row by row.
- Provides Sums and Averages for total volume and average speed.
Spikes (sudden peaks) can indicate:
- A real traffic burst (backup, image pulls, large uploads/downloads), or
- A measurement anomaly related to SNMP counters.
4) Log (Log Entries) page
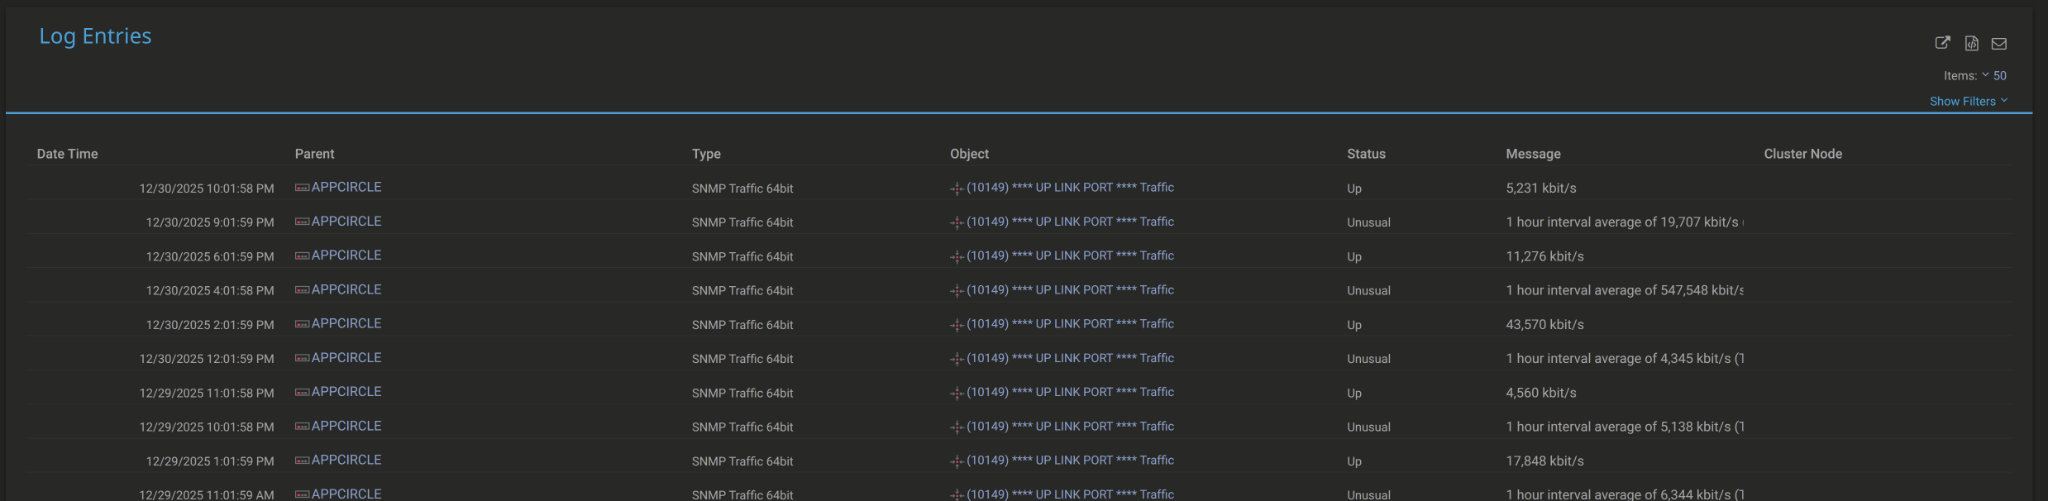
Lists event records related to the sensor.
Common columns:
- Date Time: Event timestamp.
- Type: Sensor type (for example, SNMP Traffic 64bit).
- Object: Sensor name.
- Status: State at that time (Up / Unusual, etc.).
- Message: Short event description (for example, “1 hour interval average of …”).
Unusual typically means a deviation from the normal baseline (outside expected range). It is not necessarily downtime, but it can be a useful anomaly signal worth reviewing.